 By
By 
How to Diagnose and Resolve Full Stack App Performance Bottlenecks
For over 15 years in the trenches of software development, I've witnessed firsthand the silent killer of promising applications: performance bottlenecks. It’s not always about groundbreaking features; often, it’s the insidious lag, the spinning loader, or the dreaded '500 Internal Server Error' that erodes user trust and ultimately, business success. I’ve seen companies pour millions into marketing only to lose customers to a sluggish user experience, a problem that could have been identified and mitigated with the right approach.
The frustration is palpable when your meticulously crafted full stack application, a symphony of frontend, backend, and database technologies, starts to falter under load. You've built it to scale, to perform, yet users are complaining, dashboards are red, and the codebase feels like a tangled web where every fix introduces a new bug. Pinpointing the exact culprit in a complex, distributed system can feel like searching for a needle in a haystack, especially when the issue could be hiding anywhere from a misconfigured server to an unoptimized CSS rule.
But fear not. In this definitive guide, I will share the battle-tested strategies, diagnostic tools, and practical frameworks I've honed over years of tackling the most stubborn performance issues. You'll learn not just what to look for, but how to systematically approach performance diagnosis, identify the root causes, and implement effective, lasting solutions. We'll cover everything from frontend rendering to database query optimization, ensuring you have the knowledge to confidently diagnose and resolve full stack app performance bottlenecks, transforming your slow applications into high-performing powerhouses.
The Full Stack Performance Puzzle: Where to Begin?
Before we dive into specific layers, it's crucial to understand the interconnected nature of a full stack application. A performance issue in one component often ripples through the entire system, making initial diagnosis challenging. A slow database query might manifest as a sluggish API response, which then causes a delayed frontend render. Without a holistic view, you might waste time optimizing the wrong part of your stack.
Understanding the Layers: Frontend, Backend, Database, Infrastructure
To effectively diagnose, we must first compartmentalize. Each layer presents its own set of unique challenges and potential bottlenecks:
- Frontend (Client-side): This is what the user directly interacts with – browser rendering, JavaScript execution, asset loading (images, CSS, fonts). Issues here often relate to large bundle sizes, inefficient rendering, or excessive network requests.
- Backend (Server-side): The application logic that processes requests, interacts with databases, and communicates with external services. Bottlenecks can stem from inefficient code, slow API integrations, or resource-intensive computations.
- Database: The heart of most applications, responsible for data storage and retrieval. Common problems include slow queries, missing indexes, or unoptimized schema designs.
- Infrastructure & Network: The underlying hardware, cloud services, network latency, and server configurations that support your application. Insufficient CPU, RAM, or network bandwidth can cripple even the most optimized code.
Frontend Performance: The User's First Impression
In today's fast-paced digital world, users have zero patience for slow-loading websites. A study by Google found that as page load time goes from 1s to 3s, the probability of bounce increases by 32%. This isn't just about aesthetics; it directly impacts user engagement, conversion rates, and even SEO rankings. Optimizing the frontend is about enhancing the perceived and actual speed for the end-user.
Common Frontend Bottlenecks
- Large JavaScript and CSS Bundles: Shipping megabytes of code prolongs download and parse times.
- Unoptimized Images and Media: High-resolution images not properly compressed or responsively served can be huge performance drains.
- Render-Blocking Resources: JavaScript and CSS that prevent the browser from rendering the page until they are fully loaded and parsed.
- Excessive DOM Manipulation: Frequent and inefficient updates to the Document Object Model can cause layout thrashing and slow down rendering.
- Third-party Scripts: Analytics, ads, and other external scripts can often introduce significant delays beyond your control.
Tools & Techniques for Diagnosis
I always start with browser-based tools, as they provide an immediate, user-centric view of performance:
- Google Lighthouse: An automated tool for auditing performance, accessibility, SEO, and best practices. It gives actionable recommendations.
- Chrome DevTools (Performance & Network Tabs): Invaluable for deep dives. The Performance tab visualizes CPU usage, rendering, and script execution over time, while the Network tab shows individual request timings, sizes, and waterfalls.
- WebPageTest: Offers detailed analysis from various locations and devices, including filmstrip views and waterfall charts, simulating real-world user conditions.

Once you've identified the problem areas, here are some actionable steps:
- Optimize Images: Use modern formats (WebP, AVIF), compress them, and implement responsive images (
srcset). Consider lazy loading images below the fold. - Minify & Compress Assets: Reduce JavaScript, CSS, and HTML file sizes through minification and GZIP/Brotli compression.
- Eliminate Render-Blocking Resources: Defer non-critical JavaScript using
deferorasyncattributes, and extract critical CSS for inline inclusion. - Implement Code Splitting & Tree Shaking: Deliver only the necessary code for the current view, reducing initial load times.
- Leverage Browser Caching: Set appropriate caching headers for static assets to reduce repeat visits' load times.
Backend Performance: The Engine Room
While frontend performance is about user perception, backend performance is about raw processing power and efficiency. A slow backend can lead to unresponsive UIs, timeouts, and a cascade of errors. This is where the core business logic resides, making its optimization critical for the application's stability and scalability.
Identifying API Latency and Resource Hogs
Backend bottlenecks are often more insidious because they don't always manifest as clearly as a slow-loading image. They can be:
- Slow Database Queries: As we'll discuss, this is a frequent culprit.
- Inefficient Algorithms & Business Logic: N2 or higher complexity algorithms processing large datasets can quickly bring a server to its knees.
- External API Dependencies: Calls to third-party services (payment gateways, authentication providers) can introduce latency beyond your control.
- Memory Leaks: Unreleased memory can lead to increased garbage collection, higher CPU usage, and eventual crashes.
- Network Latency within the Data Center: Even internal service-to-service communication can be slow if not properly configured or if services are geographically dispersed.
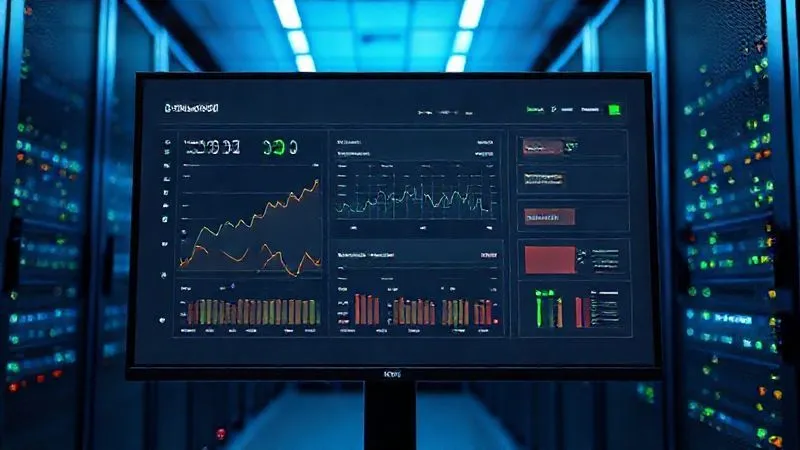
Monitoring & Profiling Backend Applications
To truly understand backend performance, you need robust monitoring and profiling tools:
Application Performance Monitoring (APM) Tools: Solutions like New Relic, Datadog, or AppDynamics provide deep visibility into application transactions, database queries, external calls, and infrastructure metrics. They help you pinpoint exactly which API endpoint is slow and why.
Code Profilers: These tools analyze your code's execution path, showing you exactly how much time is spent in each function or method. Most languages have built-in or popular third-party profilers (e.g., Node.js perf_hooks, Python cProfile, Java VisualVM).
- Instrument Your Code: Add logging and tracing to critical paths to measure execution times.
- Use an APM Tool: Deploy an agent to collect metrics on request latency, error rates, and resource utilization.
- Profile During Load Tests: Run profilers while your application is under simulated load to identify bottlenecks that only appear at scale.
- Analyze Stack Traces: Look for long-running operations, frequent garbage collection, or excessive I/O wait times.
| Metric | Acceptable Threshold | Common Bottleneck |
|---|---|---|
| Average API Latency | < 200ms | Database, external APIs, complex logic |
| Error Rate | < 0.1% | Bugs, misconfigurations, resource exhaustion |
| CPU Utilization | < 70% (sustained) | Inefficient code, too many requests, memory leaks |
| Memory Usage | Stable, not continuously growing | Memory leaks, large data structures, inefficient caching |
Database Performance: The Foundation of Speed
In my experience, if you're facing performance issues and you haven't looked at your database, you're likely missing the biggest culprit. Databases are often the silent killer of application speed. A single unoptimized query fetching millions of rows can bring an entire application to a halt, regardless of how fast your frontend renders or your backend processes.
Diagnosing Slow Queries
Identifying database bottlenecks requires a keen eye and specific tools:
- Missing or Inefficient Indexes: The most common issue. Without proper indexes, the database has to scan entire tables to find data.
- N+1 Query Problem: A pattern where an application executes one query to retrieve a list of items, and then N additional queries (one for each item) to fetch related data.
- Unoptimized Schema Design: Poor table relationships, lack of normalization/denormalization where appropriate, or storing large blobs directly in the database.
- Large Datasets & Joins: Queries involving complex joins on very large tables can be computationally expensive.
- Locking Issues: Concurrent transactions can lead to locks, causing other queries to wait, especially in high-concurrency environments.
Optimization Strategies
Database optimization is an art and a science. Here’s how I approach it:
- Analyze Slow Query Logs: Most databases (e.g., PostgreSQL, MySQL) have settings to log queries exceeding a certain execution time. Start here to find the worst offenders.
- Add Appropriate Indexes: Based on your query patterns, create indexes on columns frequently used in
WHEREclauses,JOINconditions, andORDER BYclauses. But be mindful: too many indexes can slow down writes. - Refactor N+1 Queries: Use eager loading (e.g.,
JOIN FETCHin ORMs, or explicitJOINs) to fetch all necessary related data in a single query. - Optimize Query Structure: Avoid
SELECT *; only fetch the columns you need. Break down complex queries into simpler ones if possible. - Implement Caching: Use in-memory caches (like Redis or Memcached) for frequently accessed, immutable, or slowly changing data. Cache query results at the application layer.
- Connection Pooling: Efficiently manage database connections to reduce the overhead of establishing new connections for every request.
Case Study: How 'DataFlow Solutions' Slashed Report Generation Time
DataFlow Solutions, a SaaS company providing analytics dashboards, struggled with report generation times that often exceeded 5 minutes for large clients. Their backend engineers were initially stumped, suspecting API latency. After implementing detailed database query logging and using EXPLAIN ANALYZE on their PostgreSQL database, I helped them discover several queries performing full table scans on multi-million-row tables. By strategically adding composite indexes, optimizing a few key JOIN operations, and introducing a Redis cache layer for pre-computed daily aggregates, they achieved a remarkable reduction. Report generation for even their largest clients dropped to under 30 seconds, leading to a 40% increase in customer satisfaction scores and enabling them to upsell premium analytics features.
Expert Insight: "Never underestimate the power of a well-placed index or a refactored N+1 query. The database is often the most significant lever you have for performance gains, yet it's frequently the last place developers look."
Infrastructure & Network: The Invisible Hand
Even with perfectly optimized code, a suboptimal infrastructure or network configuration can choke your application. This layer is often overlooked, but it's the foundation upon which your entire full stack application rests. Think of it as the plumbing and electricity for your house – without it, nothing else works efficiently.
Server Resources & Configuration
Your application servers, database servers, and any other services need adequate resources:
- CPU: Insufficient processing power can lead to high load averages and slow response times, especially for CPU-bound tasks.
- RAM: Lack of memory results in excessive swapping to disk, which is significantly slower. Memory leaks exacerbate this.
- Disk I/O: For applications that frequently read from or write to disk (e.g., logging, file uploads, large database operations), slow disk I/O can be a major bottleneck. Consider SSDs or provisioned IOPS.
- Network Bandwidth: Ensure your servers have enough network capacity to handle incoming requests and outgoing responses, as well as inter-service communication.
- Operating System & Web Server Tuning: Optimize OS kernel parameters, web server (Nginx, Apache) configurations, and application server (Gunicorn, PM2) settings for your specific workload.
CDN, Load Balancers, and DNS
These components are critical for global performance and reliability:
- Content Delivery Networks (CDNs): Distribute your static assets (images, CSS, JS) to edge servers geographically closer to your users, drastically reducing latency and load times for frontend resources.
- Load Balancers: Distribute incoming traffic across multiple application instances, preventing any single server from becoming a bottleneck and improving fault tolerance. Properly configured load balancers can also handle SSL termination and health checks.
- DNS Configuration: Optimize DNS lookup times. Use a fast and reliable DNS provider, and ensure appropriate TTL (Time-To-Live) settings for your records.

Proactive Performance Management: Beyond Reactive Fixes
Reactive problem-solving is costly. The true mark of an experienced team is a shift from fixing issues after they occur to preventing them altogether. Proactive performance management involves continuous monitoring, automated testing, and integrating performance considerations throughout the development lifecycle.
Continuous Monitoring & Alerting
Once you’ve identified and resolved bottlenecks, the work isn’t over. You need to ensure they don't reappear and that new ones don't emerge. Set up comprehensive dashboards that track key performance indicators (KPIs) across all layers of your stack. Configure alerts for deviations from baseline performance (e.g., API latency spikes, high CPU usage, increased error rates). Tools like Prometheus and Grafana, or integrated APM solutions, are indispensable here.
Performance Testing in CI/CD
Integrating performance testing into your Continuous Integration/Continuous Deployment (CI/CD) pipeline is a game-changer. This ensures that every new code deployment doesn't inadvertently introduce performance regressions.
- Load Testing: Simulate a large number of concurrent users to see how your application behaves under expected peak load.
- Stress Testing: Push your application beyond its normal operational limits to determine its breaking point and how it recovers.
- Soak Testing: Run tests over an extended period to identify memory leaks or resource exhaustion that might only appear after sustained usage.
- Regression Testing: Automatically run performance benchmarks against previous versions to detect any degradations.
For more insights on integrating performance testing, I highly recommend exploring resources like Martin Fowler's work on Continuous Integration, which emphasizes early and frequent testing.
The Human Element: Team Collaboration and Best Practices
Performance optimization isn't just a technical challenge; it's also a cultural one. The most robust technical solutions can fall apart without strong team collaboration, shared knowledge, and a commitment to performance as a core value. I've often seen that the biggest bottleneck isn't in the code, but in the communication flow and processes of the development team.
Code Reviews & Knowledge Sharing
Treat code reviews not just as bug-catching exercises, but as opportunities to discuss performance implications. Encourage developers to think about time complexity, database query patterns, and resource usage during the review process. Regular knowledge-sharing sessions or "lunch and learns" where team members present on performance topics can significantly elevate the collective expertise.
According to a study published in the Harvard Business Review, effective code reviews not only improve code quality but also foster a culture of continuous learning and shared responsibility, both crucial for maintaining high-performing applications.
Documentation & Playbooks
Document your performance issues, their diagnoses, and their resolutions. Create playbooks for common scenarios. This institutional knowledge is invaluable for new team members and ensures that past mistakes aren't repeated. A well-documented troubleshooting guide can cut down diagnosis time from hours to minutes during a critical incident.

Frequently Asked Questions (FAQ)
What's the biggest mistake developers make when optimizing for performance? In my experience, the single biggest mistake is premature optimization – optimizing code paths that aren't actual bottlenecks. This leads to wasted effort, increased complexity, and sometimes even new bugs. Always profile and measure first; optimize only what's proven to be slow. Another common mistake is neglecting the database layer.
How do I prioritize performance fixes when I have many bottlenecks? Focus on the 'low-hanging fruit' first – issues that are easy to fix and provide significant impact. Use the Pareto principle (80/20 rule): identify the 20% of bottlenecks causing 80% of the pain. Prioritize based on user impact (e.g., a critical user journey being slow), business impact (e.g., impacting conversion rates), and the effort required for the fix. APM tools often help quantify this impact.
When should I consider scaling my infrastructure versus optimizing my code? This is a classic dilemma. My rule of thumb: optimize first, then scale. Throwing more hardware at inefficient code is a temporary, expensive fix that merely postpones the inevitable. Once your code is as efficient as reasonably possible, then scaling (e.g., adding more servers, using a CDN, sharding databases) becomes a viable and cost-effective strategy to handle increased load.
Are microservices always better for performance? Not inherently. While microservices can offer benefits like independent scaling and technology choice, they also introduce significant overhead in terms of network communication, distributed tracing, and operational complexity. A monolithic application with well-defined modules can often outperform a poorly designed microservices architecture. Choose microservices for architectural reasons (e.g., team autonomy, domain separation), not purely as a performance silver bullet.
How do I convince management to invest in performance optimization? Speak their language: business impact. Quantify the cost of poor performance in terms of lost revenue (e.g., decreased conversions, abandoned carts), increased operational costs (e.g., higher infrastructure bills due to inefficient code), reduced employee productivity, and reputational damage. Present data (e.g., "a 1-second delay costs X% in conversions") and propose a clear ROI for performance initiatives.
Key Takeaways and Final Thoughts
Mastering how to diagnose and resolve full stack app performance bottlenecks is a critical skill for any serious developer or engineering leader. It's a journey that demands patience, systematic thinking, and a deep understanding of every layer of your application. Remember, performance isn't a feature; it's a fundamental requirement for a successful digital product.
- Adopt a Layered Approach: Systematically examine frontend, backend, database, and infrastructure.
- Trust Your Tools: Leverage browser dev tools, APMs, and profilers for data-driven diagnosis.
- Database First: Often the most impactful area for optimization.
- Proactive > Reactive: Integrate monitoring and performance testing into your development lifecycle.
- Cultivate a Performance Culture: Empower your team through knowledge sharing and best practices.
The path to a high-performing application is iterative, but incredibly rewarding. By applying the strategies I've outlined, you're not just fixing bugs; you're building a more robust, scalable, and user-friendly product. Embrace the challenge, keep learning, and your applications will not only meet but exceed user expectations, driving sustained success for your business.
Recommended Reading
- Is a Web Development Course Worth It? Unlocking Your High-Paying Tech Future
- 7 Proven Strategies: Fast-Track Wireframe Approval Despite Conflicting Feedback
- 5 Proven Strategies: Guaranteeing Deterministic Latency in Industrial Real-Time CPS
- Startup Off-Track? 7 Expert Steps When Accelerator Milestones Slip
- 7 Strategies to Validate Emergent Behavior in Complex Autonomous CPS Systems








0 Comentários: