 By
By 
How to Diagnose and Fix Intermittent CI/CD Pipeline Failures?
For over 15 years in the trenches of DevOps and automation engineering, I’ve witnessed countless teams grapple with a particularly insidious problem: the intermittent CI/CD pipeline failure. It’s the phantom menace of modern software delivery – one moment your pipeline is green, the next it’s red, only to mysteriously pass on a re-run. This isn't just an annoyance; it’s a silent killer of productivity, trust, and team morale.
These unpredictable failures erode confidence in your automated processes, leading to manual workarounds, delayed releases, and a constant state of anxiety. Developers waste precious hours re-running builds, chasing ghosts in logs, and questioning the reliability of their own infrastructure. The cumulative cost in lost time and missed opportunities can be staggering, often far exceeding the initial investment in CI/CD automation itself.
In this definitive guide, I’ll share my battle-tested framework for not just identifying, but systematically eradicating these elusive issues. We'll delve into actionable strategies, real-world case studies, and expert insights that will empower you to transform your flaky pipelines into robust, predictable delivery machines. You’ll learn how to diagnose and fix intermittent CI/CD pipeline failures with confidence, ensuring your automation truly serves your team, not frustrates it.
Understanding the Elusive Nature of Intermittent Failures
Intermittent CI/CD failures are notoriously difficult to pin down because they lack a consistent pattern. Unlike a hard error that always breaks the build, an intermittent failure might only occur 10% of the time, or under specific, hard-to-replicate conditions. This unpredictability makes traditional debugging methods inefficient and frustrating.
The "Works on My Machine" Syndrome
One of the most common refrains heard in teams plagued by intermittent failures is "it works on my machine." This usually points to environmental inconsistencies between a developer's local setup and the CI/CD environment. Subtle differences in operating system versions, installed libraries, environment variables, or even network configurations can lead to divergent behaviors that only manifest in the pipeline.
The Cost of Flakiness
Beyond the immediate frustration, flaky pipelines carry a significant hidden cost. They lead to a lack of trust in automation, increasing the likelihood of manual interventions or even skipping crucial steps like automated testing. This can inadvertently introduce more bugs into production, negating the very benefits CI/CD is designed to provide. A study by DORA (DevOps Research and Assessment) consistently highlights that reliable pipelines are a hallmark of high-performing teams.
"Intermittent failures are not just technical debt; they are psychological debt. They erode confidence and foster an environment of suspicion towards automation."
Step 1: Establishing a Robust Monitoring & Alerting Framework
You can't fix what you can't see. The first, and arguably most critical, step in tackling intermittent failures is to establish comprehensive monitoring and alerting. This goes beyond simple pass/fail notifications; it requires deep visibility into every stage of your pipeline's execution.
Key Metrics to Track
I've always advocated for a "metrics-driven" approach to pipeline health. Focus on:
- Build Success Rate: Not just the overall rate, but success rates per job, per stage, and per branch.
- Build Duration: Track the time taken for each stage. Spikes can indicate resource contention or external dependency issues.
- Test Duration & Pass Rate: Identify tests that are consistently slow or flaky.
- Resource Utilization: CPU, memory, disk I/O on build agents. Overloaded agents are a common cause of flakiness.
- Artifact Size & Cache Hit Rate: Unexpected changes can point to dependency issues or caching problems.
- Deployment Frequency & Lead Time for Changes: High-level indicators of overall delivery health.
Proactive Alerting Strategies
Don't wait for developers to complain. Configure alerts for:
- Significant drops in success rate: If a specific job's success rate dips below a threshold (e.g., 95%), alert immediately.
- Unusual increases in build duration: A 20% increase in average stage duration should trigger an investigation.
- Resource exhaustion: Alerts when build agents hit high CPU/memory usage for extended periods.
- Dependency failures: If an external service or package repository becomes unreachable.
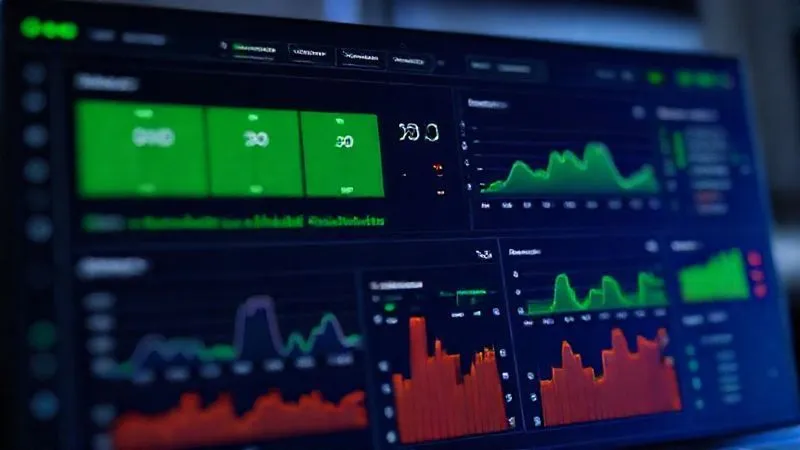
A well-configured dashboard, as shown below, provides an instant overview of your pipeline's health, allowing you to spot anomalies before they escalate.
Step 2: Deep Dive into Logs and Artifacts
Once monitoring flags an anomaly, your next step is to dive into the raw data. Logs and build artifacts are the breadcrumbs that lead you to the root cause of intermittent failures. This requires more than just skimming; it demands a systematic approach to log analysis.
Centralized Logging Systems
Relying on individual build logs scattered across different agents is a recipe for frustration. Implement a centralized logging solution (e.g., ELK Stack, Splunk, Datadog Logs) that aggregates all pipeline logs. This allows for:
- Cross-run comparison: Easily compare logs from a failed run with a successful run.
- Keyword searching: Quickly find error messages, warnings, or specific events.
- Contextual analysis: Correlate pipeline logs with infrastructure logs, application logs, and even external service logs.
- Historical trend analysis: Identify patterns over time, even for infrequent issues.
Analyzing Build Artifacts
Build artifacts (compiled code, test reports, dependency lists, Docker images) contain crucial information. For example, comparing the dependency tree of a successful build to a failed one can quickly reveal version mismatches or missing packages. Always ensure your pipeline stores artifacts for failed runs, not just successful ones.
Leveraging Distributed Tracing
For complex microservices architectures, distributed tracing (e.g., Jaeger, Zipkin) becomes invaluable. It allows you to visualize the flow of requests and operations across multiple services, pinpointing latency spikes or errors that might be causing downstream pipeline failures. This is particularly useful when your CI/CD pipeline interacts with multiple external services during integration or deployment phases.
Step 3: Isolating the Environment: Consistency is Key
Environmental inconsistencies are perhaps the most common culprit behind the "works on my machine" syndrome and intermittent failures. Your CI/CD environment must be as consistent and reproducible as possible, from the operating system to the smallest dependency.
Containerization and Immutable Infrastructure
This is where Docker and Kubernetes shine. By containerizing your build environments, you ensure that every build runs in the exact same isolated, predefined environment. This eliminates variations in installed software, libraries, and configurations. Similarly, adopting immutable infrastructure principles means that instead of updating existing build agents, you replace them entirely with new, pristine instances for each build or run.
Consider this comparison of build environment variables:
| Variable | Local Dev | CI/CD (Old) | CI/CD (New) |
|---|---|---|---|
| NODE_VERSION | 16.14.0 | 14.17.6 | 16.14.0 |
| PYTHON_PATH | /usr/local/bin/python3 | /usr/bin/python | /usr/local/bin/python3 |
| DB_CONN_STRING | localhost:5432 | testdb.prod.com | testdb.staging.com |
| JAVA_HOME | /opt/jdk-11 | /usr/lib/jvm/java-8 | /opt/jdk-11 |
The table above clearly illustrates how differing environment variables can lead to intermittent failures. Ensuring consistency across environments is paramount.
Standardizing Build Agents
If you're not fully containerized, at least standardize your build agents. Use configuration management tools (Ansible, Chef, Puppet) to provision and maintain agents with identical software versions, patches, and configurations. Regularly audit these agents to prevent configuration drift.
Dependency Management & Version Pinning
Never rely on "latest" versions for dependencies in your CI/CD pipeline. Always pin exact versions of libraries, packages, and tools (e.g., npm install package@1.2.3, pip install library==4.5.6). This prevents unexpected breaking changes from upstream dependencies from creeping into your builds and causing intermittent failures. Use dependency lock files (package-lock.json, yarn.lock, Pipfile.lock) religiously.
Step 4: Tackling Flaky Tests: The Silent Killers
Flaky tests are tests that sometimes pass and sometimes fail on the same code, without any code changes. They are a massive source of intermittent pipeline failures and one of the most frustrating to diagnose. They destroy confidence in your test suite, leading teams to ignore test failures entirely.
Identifying Flaky Tests Automatically
Manually identifying flaky tests is a nightmare. Instead, leverage tools that can do this for you. Many CI/CD platforms offer built-in flakiness detection, or you can integrate specialized tools. The key is to run tests multiple times on the same commit and track their pass/fail history. Tests with a non-100% pass rate are immediately suspect.
Once identified, isolate these tests. Don't remove them, but quarantine them. Run them separately, perhaps in a dedicated job, until they can be fixed. This prevents them from blocking your main pipeline.
Strategies for Test Isolation and Parallelization
Common causes of flakiness include:
- Race Conditions: Tests that depend on the order of execution or shared mutable state.
- External Dependencies: Tests that rely on external services (databases, APIs) that are slow, unreliable, or have transient errors.
- Asynchronous Operations: Improper handling of async code, leading to tests finishing before operations complete.
- Time-Dependent Logic: Tests that break around midnight or on specific dates.
- Resource Leaks: Tests that don't clean up resources, impacting subsequent tests.
To fix these, focus on:
- Test Isolation: Ensure each test runs in its own clean slate. Use fresh database instances, mock external services, or reset application state before each test.
- Deterministic Execution: Avoid reliance on system time or random values where possible.
- Robust Waits: For async operations, use explicit waits (e.g., wait until element is visible) rather than arbitrary sleep timers.
- Parallelization: Design tests to run independently, allowing them to be executed in parallel without interference.
Case Study: GlobalTech's Journey from Flaky Hell to Test Nirvana
GlobalTech, a rapidly scaling SaaS company, was plagued by daily intermittent CI/CD failures, 70% of which were attributed to flaky integration tests. Their developers spent 2-3 hours daily re-running pipelines, leading to a palpable sense of frustration and missed release targets. The team was hesitant to trust their CI/CD, often deploying directly to staging without full test runs.
I advised them to implement a structured approach:
- Flakiness Detection: They integrated a custom script that re-ran every failing test up to 3 times. If a test passed on a re-run, it was flagged as flaky and moved to a 'quarantine' suite.
- Root Cause Analysis Sprints: Dedicated developers were assigned weekly sprints to systematically fix quarantined tests. They found issues ranging from shared database state across tests to subtle race conditions in their UI automation.
- Environment Standardization: They containerized their test runners using Docker, ensuring consistent environments for every test execution.
- Mocking External Services: For integration tests, they heavily adopted service virtualization and mocking frameworks, reducing reliance on slow or unreliable external APIs.
Within three months, GlobalTech reduced their flaky test count by 90%, slashing daily pipeline re-runs from hours to minutes. This resulted in a 25% increase in developer productivity and a significant boost in deployment frequency. Their confidence in the CI/CD pipeline was fully restored, proving that investing in test reliability pays massive dividends.
Step 5: Resource Contention and External Dependencies
Even with perfectly consistent environments and robust tests, intermittent failures can arise from resource contention or unreliable external dependencies. These often manifest as timeouts, connection errors, or inexplicable hangs.
Network Latency and External API Calls
Many CI/CD pipelines interact with external services: package repositories, Docker registries, cloud provider APIs, third-party authentication services, or even internal microservices. Transient network issues, rate limiting by external APIs, or slow responses can all lead to intermittent failures. Monitor the latency and error rates of all external calls within your pipeline. Implement robust retry mechanisms with exponential backoff for these calls.
Database Connection Pooling and Race Conditions
If your pipeline performs database migrations or runs tests that interact with a database, ensure your database connection pooling is correctly configured. Insufficient pool sizes can lead to connection exhaustion and intermittent failures, especially under high concurrency. Race conditions can occur if multiple pipeline jobs or parallel tests try to modify the same database records simultaneously. Implement proper locking mechanisms or ensure tests operate on isolated data sets.
Throttling and Rate Limiting
Your CI/CD tools themselves, or the services they interact with, might impose throttling or rate limits. For example, a cloud provider might rate-limit API calls for provisioning resources, or your internal artifact repository might have limits on download requests. Be aware of these limits and design your pipeline steps to respect them, perhaps by introducing delays or staggering requests.

Step 6: Version Control and Configuration Drift
Sometimes, the problem isn't the pipeline itself, but the changes flowing through it. Unexpected code changes, unversioned configurations, or subtle differences in branch merges can introduce intermittent issues.
Reviewing Recent Code Changes
The most straightforward approach for a newly introduced intermittent failure is to review recent code changes. If a failure appeared immediately after a specific merge, that commit is your prime suspect. Use Git's blame or bisect commands to pinpoint the exact change that introduced the instability. Pay close attention to changes in:
- Dependency versions: Upgrading a library might introduce subtle breaking changes.
- Configuration files: Environmental variables, database connection strings, API endpoints.
- Test files: New tests that are poorly written or introduce flakiness.
- Build scripts: Changes to how the application is built or packaged.
Infrastructure as Code (IaC) for Environment Consistency
As Martin Fowler often emphasizes, consistency is king. Extend the principle of version control to your infrastructure. Use Infrastructure as Code (IaC) tools like Terraform or CloudFormation to define and provision your CI/CD agents, testing environments, and dependent services. This ensures that every environment is built from a single source of truth, eliminating configuration drift over time. Any change to the infrastructure is then reviewed and versioned just like application code.
Configuration Management Best Practices
Beyond IaC for provisioning, use configuration management tools (e.g., Ansible, Puppet) for managing the state of your build agents and servers. Ensure that all necessary software, libraries, and environment variables are consistently applied. Avoid manual changes to production or CI/CD environments; everything should be codified and deployed through your automation pipeline.
Step 7: Implementing a Post-Mortem and Feedback Loop
Finally, once you've diagnosed and fixed an intermittent failure, the job isn't over. The true mark of a mature DevOps culture is learning from failures and preventing their recurrence. This requires a robust post-mortem process and a continuous feedback loop.
Blameless Post-Mortems for Learning
Adopt a blameless post-mortem culture. The goal is not to assign blame but to understand the sequence of events, identify systemic weaknesses, and implement preventative measures. Document everything: what happened, why it happened, what was the impact, and what actions will be taken. This knowledge sharing is crucial for building a resilient system. You can find excellent resources on blameless post-mortems from organizations like Google SRE.
| Field | Description |
|---|---|
| Incident Title | Brief, descriptive title of the intermittent failure. |
| Date/Time Discovered | When the failure was first observed. |
| Impact | What was affected? (e.g., Developer productivity, release delay) |
| Root Cause | The underlying reason for the failure (e.g., Race condition in tests, inconsistent env var) |
| Remediation Steps | Actions taken to fix the immediate issue. |
| Preventative Actions | Long-term changes to prevent recurrence (e.g., Update build image, refactor tests, add monitoring) |
| Lessons Learned | Key insights gained from the incident. |
This structured approach to post-mortems ensures that every intermittent failure becomes an opportunity for improvement, not just a forgotten headache.
Automating Failure Remediation
While not every failure can be automatically fixed, many can. For example, if a specific test is consistently flaky, your pipeline could automatically quarantine it and notify the relevant team. If an external service is down, the pipeline could automatically retry with exponential backoff. Identify common intermittent failure patterns and explore ways to automate their detection, diagnosis, or even temporary mitigation.
Continuous Improvement through Data
Regularly review your pipeline health metrics, post-mortem reports, and identified flaky tests. Use this data to drive continuous improvement initiatives. Are you seeing a pattern of failures related to a specific service or team? Is a particular type of test consistently failing? This data-driven approach allows you to proactively address weaknesses in your CI/CD system before they escalate into major outages.
Frequently Asked Questions (FAQ)
Q: How often should I review my pipeline logs? A: For active development pipelines, I recommend daily spot checks of recent failures and anomalies. For critical production pipelines, implement real-time alerts for any deviation from expected behavior. Beyond reactive checks, conduct weekly or bi-weekly deep dives into aggregated logs and metrics to identify subtle trends or emerging patterns that might not trigger immediate alerts. Tools with anomaly detection can significantly reduce this manual effort.
Q: What's the biggest mistake teams make when dealing with intermittent failures? A: The biggest mistake I've seen is treating intermittent failures as "one-off glitches" and simply re-running the pipeline without a deeper investigation. This creates a culture of ignoring warnings and allows the underlying issues to fester and multiply. Every intermittent failure is a symptom of a systemic problem, whether it's environmental inconsistency, a flaky test, or an unreliable dependency. Treat each one as a critical bug that needs root cause analysis and a permanent fix.
Q: Can AI/ML help predict pipeline failures? A: Absolutely, and this is an exciting frontier! AI/ML can analyze historical pipeline data – build times, resource usage, log patterns, test results – to identify subtle correlations and predict potential failures before they occur. For instance, an ML model could detect an unusual combination of resource spikes and dependency latency that often precedes a build failure. While it's still evolving, many advanced observability platforms are integrating ML for anomaly detection and predictive analytics in CI/CD.
Q: How do I convince my team to invest time in fixing flaky issues? A: Frame it in terms of business value and developer experience. Quantify the time lost due to re-runs and manual debugging. Highlight the impact on release velocity and product quality. Share the "Cost of Flakiness" from industry reports like DORA. Emphasize that fixing these issues is an investment in stability, speed, and reduced stress, ultimately leading to a more productive and happier team. Present a clear plan with achievable milestones and demonstrate early wins.
Q: What's the role of Observability in this? A: Observability is paramount. It goes beyond mere monitoring by allowing you to actively ask arbitrary questions about your system's internal state. For intermittent CI/CD failures, this means having the ability to trace a build's execution end-to-end, correlate logs from different services, understand resource consumption at a granular level, and visualize dependencies. A truly observable CI/CD pipeline provides the context needed to understand *why* a failure occurred, not just *that* it occurred, which is essential for diagnosing intermittent issues.
Key Takeaways and Final Thoughts
- Embrace a Data-Driven Approach: Monitor everything, log comprehensively, and use metrics to identify anomalies.
- Prioritize Environment Consistency: Leverage containerization, IaC, and strict dependency pinning to eliminate environmental drift.
- Ruthlessly Hunt Flaky Tests: Identify, quarantine, and fix flaky tests; they are major confidence killers.
- Account for External Factors: Monitor external dependencies and network conditions, implementing retries and backoffs.
- Version Control Everything: From code to infrastructure configuration, ensure a single source of truth.
- Foster a Learning Culture: Implement blameless post-mortems to continuously improve and prevent recurrence.
Diagnosing and fixing intermittent CI/CD pipeline failures is not a one-time task; it's an ongoing commitment to engineering excellence. It requires discipline, systematic investigation, and a culture that values stability and reliability as much as new feature development. By applying the strategies I've outlined, you'll not only resolve your current pipeline woes but also build a more resilient, efficient, and trustworthy automation system that truly accelerates your software delivery. Your team, and your customers, will thank you for it.
Recommended Reading
- Fix Erratic AI Robots: 7 Steps to Stabilize Manufacturing Automation
- Seamless Zero Trust Migration: No Downtime for Your Network Architecture
- Unlock Better UX Research: How Design Thinking Transforms Your Insights
- Your Corporate Antivirus Missed a Zero-Day: 7 Steps to Rebuild Defenses
- 8 Pro Strategies: How to Fix Excessive Re-renders Slowing Down React Apps







0 Comentários: